Categories
 Each Target configuration is displayed on its own row. The same configuration can be divided into several experiments.
When you first set up a new Target configuration, the first step is the data collection mode. In this mode we collect data for the algorithm by having only random and control groups. The control group will not receive the treatments at all and the members in the random group will receive the treatment randomly. The treatment is the action you have configured when creating the Target rule.
When we have enough data, the system will go into target mode. In this mode we have three groups
- Control
- Random
- Target
Control and random groups work as before and are there for the comparison. The target group is used to serve the treatment based on our algorithm. The algorithm predicts conversion probabilities and directs treatments to the ones fulfilling the set criteria.
SELECTING THE TARGET CONFIGURATION
- Select the Target you want to explore.
- Select the time range from the dropdown: 7 days, 4 or 8 weeks
- Pick the end date for the time range you want to explore
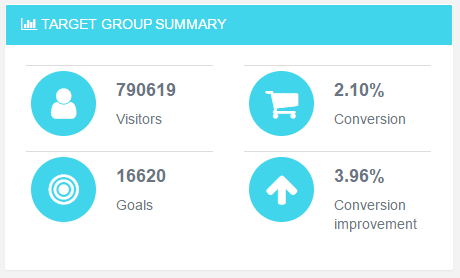
SUMMARY
The summary table shows the metrics for the Target group. The same metrics can be found in the results table.
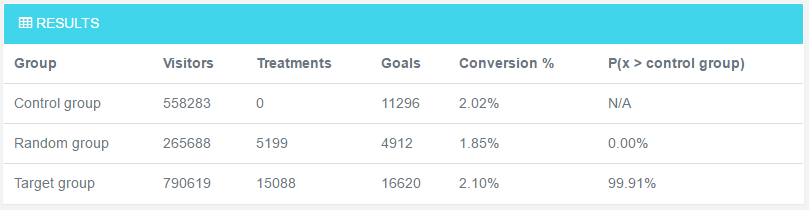
RESULTS TABLE
Shows the metrics for each group in the experiment
| Group |
Shows the groups that are part of the experiment.
|
| Visitor |
Shows the amount of distinct visitors in each group. Each visitor is counted only once in the selected timeframe. |
| Treatments | Total number of treatments targeted in this group. A single visitor may have received multiple treatments. |
| Goals | Total number of reached goals by the visitors in this group. A single visitor may have reached the goal multiple times. |
| Conversion % | The conversion rate of the group. |
| P( x > reference group) (Test for statistical significance) |
Describes the probability that the group performs better than the reference group. >50%: The performance is better than the control group <50%: The performance is worse than the control group Results above 95% and below 5% are considered statistically significant. At the beginning of the experiment the values can vary a lot. |
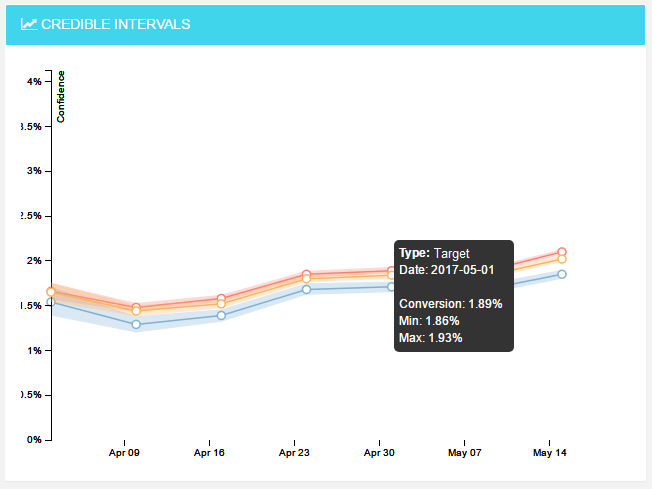
CREDIBLE INTERVALS
Describes the range where the conversion rate is for each group with 95% probability. We model the conversion rate p with beta distribution. The 95% confidence interval is the most narrow range that captures 95% of the probability mass. This is also known as the highest posterior density or highest density interval.
The values for the selected period are calculated from cumulative weekly counts of reached goals and unique visitors. E.g. if the selected period is four weeks, the first week’s values come from the first week’s counts. The second week’s values are calculated from the counts for first AND second week, third week from first, second and third weeks’ counts etc. Note that Unique Visitor Count for two weeks is usually not the first and second weeks’ counts summed, because there most probably are visitors that visit the site on both weeks.
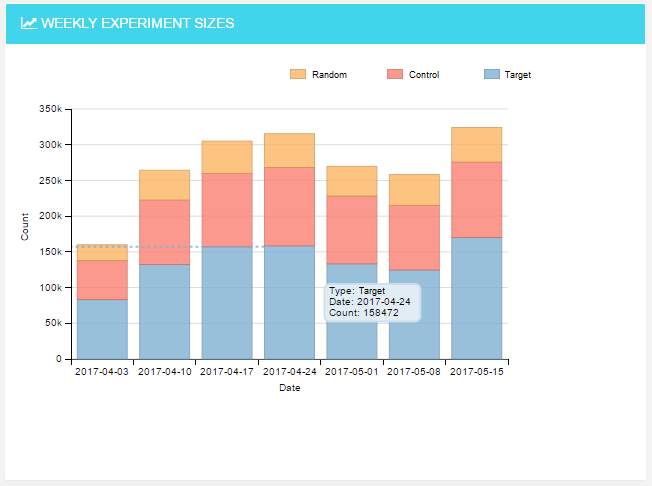
WEEKLY EXPERIMENT SIZES
Shows how many visitors were in each group per week. These are unique visitors per weekly period, so one visitor is counted only once per week.